Wassup guys?
Let's talk today about a very interesting topic of imbibing Power BI reports, fetching data from Microsoft Fabric Lakehouse. Microsoft Fabric is an extremely powerful toolhouse that encompass not just data storing and engineering mechanism, but also UI rich built-in reporting capabilities and real-time analytics.
Before we begin, let me give you a short recap on what Microsoft Fabric is all about:
Microsoft Fabric is an end-to-end analytics and data platform designed for enterprises that require a unified solution. It encompasses data movement, processing, ingestion, transformation, real-time event routing, and report building. Microsoft Fabric is a data analytics platform that helps organizations manage, access, and act on data. It's designed to address all aspects of an organization's analytics needs, including all ingredients of data movement like: data processing, ingestion, and transformation, as well as real-time analytics to allow users to explore, analyze, and act on large volumes of streaming data in near-real time.
Essentially the Fabric could be a well-designed mechanism to separate each and every department of you your organization, by creating separate Workspaces. In a word, Workspaces are places to collaborate with colleagues to create collections of items such as lakehouses, warehouses, and reports, and to create task flows.
.
Just before we jump to our next topic, let me introduce you to Lakehouse (just in case, you've not encountered them already): which is a very powerful data architecture platform for storing, managing, and analyzing structured and unstructured data in a single location.
Create a Free access to Microsoft Fabric, by visiting: https://app.fabric.microsoft.com/ , using the ID that will be cerated from the above. This will create neecessary capacities for Microsoft Fabric, with enough provisions to let you do enough of R&Ds for 60 days ✌✌✌
Once you login, your landing page should look like:
Look at the URL from the address bar. Note that, I have purposely kept the experience= data-engineering. You can change this to PowerBI, if you wish to explore Power BI capabilities of MS Fabric.
Once done, you can create a new Workspace from as follows:
Give a suitable name:
Click on Advanced >> License mode >> Select Trial:
Uh, ok -- once this is done, in your newly created workspace >> Click on New >>
Click on More Options: select Lakehouse from the below choices:
Press Create to continue.
Now our Lakehouse is ready, we can ingest data into it, by various processes, as described in my previous posts:
https://subsd365.blogspot.com/2024/10/bring-data-to-microsoft-fabric-onelake.html
https://subsd365.blogspot.com/2024/10/step-by-step-bring-d365f-data-to.html
https://subsd365.blogspot.com/2024/10/bring-data-from-dataverse-to-microsoft.html
As well as a litter of integration utitlies: for example when you click on Lakehouse >> Get Data >> New data pipeline:
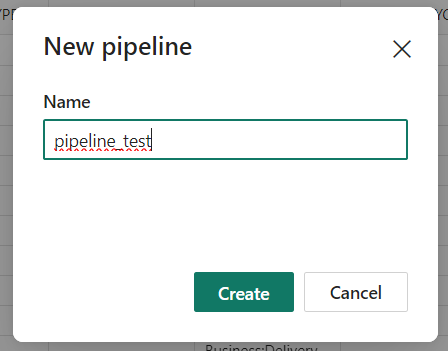
This will prompt a Pipeline creation Prompt, which you can give a proper name and click Create to continue:
This will let you bring data in from a plethora of sources:
Ok -- let us come to the main topic of the article now.
You can view the data in your Lakehouse as follows:
Implying, your data could be stored both as in Tables as well as in Files. In fact Microsoft Fabric stores all data under one roof of '
OneLake datahub': an omnichannel guesthouse of data store from all sources/origins.
Change your experience to Microsoft Fabric:
Come to your created Lakehouse and select the mode to SQL Analytics Endpoint. from the top right corner of the window:
This will show you, your data tables along with ability to create query, functions, stored procs and views.
I have created a view beforehand which fetches all details from sales headers and lines:
Select mode to Report tab:
Select New report >> This will enable you to select datasets to create new report:
I will be selecting the view which I created earlier and use it to create a snapshot of how my inventories are moving (which items are getting sold most):
I amd preparing a Stack-Columned chart, with selected Item number and sum of Qtys ordered across sales orders, with X-axis having Items and Y-axis implying the Qty counts:
This will create a report that neatly looks like this:
Whew!!! -- That creates your first Fabric Power BI report. However there are more features which you can keep adding more complexitites(ex: enabling drill through reports, more complex calculations based reports) that you can bring in. For example, click on home >> new Report:
Add data to your project, by selecting a published semantic model:
Select the lakehouse from where you want to fetch the data:
Click on 'Auto-create Report' >> Click Pre-select Data >> For example I would like to view Customer wise sales orders count:
This will create a cool visualization like this:
Click on Save >> Give a proper name >> and then Pin this report to your dashboard, for later reference.
And goes without saying, these data are all auto refreshed, so you don't need to reload the report again.
Let me stop here. We can explore more on Microsoft Fabric capabilities on another blog. Much love and Namaste as alsways 💓💓💓


 Like
Like Report


*This post is locked for comments